Full Guide to Flexible Evaluation
While our standard evaluations require following a simple, single step and single-turn input<>output schema, flexible evaluations use a fully flexible schema enabling users to test all kinds of GenAI use cases at various complexity levels.
This guide outlines step by step how to use flexible evaluations:
- Create a Flexible Evaluation Datasets with multiple inputs and expected outputs of various types
- Define Flexible Outputs that allow your application to produce multiple outputs of complex types
- Attach Traces to Outputs to record the intermediate step your application took to arrive at the final output
- Attach Metrics to Outputs to record numerical values associated with the output, such as custom automatic evaluations
- Customizing the annotation UI to allow human annotators to see the data that is relevant for them to annotate.
Before you dive into the details:
You may want to look at the Flexible Evaluation Recipe or the Simple Flexible Evaluation Guide to get a feel for how flexible evaluation can be used. To understand when to use flexible evaluation, see Why Use Flexible Evaluation.
Flexible Evaluation Datasets
To get started with flexible evaluations, create a new evaluation dataset with schema_type="FLEXIBLE":
from scale_gp import SGPClient
sgp_client = SGPClient(...)
flexible_evaluation_dataset = sgp_client.evaluation_datasets.create(
    name="example flexible evaluation dataset", # specify all the usual evaluation dataset fields
  ...,
  schema_type="FLEXIBLE" # set schema_type="FLEXIBLE
)
Evaluation datasets are wrappers for test cases, so we need to add test cases next.
The test cases in standard (schema_type="GENERATION") datasets can only have strings as input and expected_output. Flexible evaluation datasets allow for input and expected_output to be a dictionary where each key is a string and each value is one of the following:
- String
- Number (i.e., integer or float)
- Messages (list of objects with "role" and "content" fields)
"role":"user","assistant", or"system""content": string- Example:
[{"role": "user", "content": "What is albert einstein known for"}, {"role: assistant", "content": "Albert Einstein is known for this contributions to theoretical physics..."}]
- Chunks (list of objects with "text" and optionally a "metadata" field)
"text": string"metadata": dictionary of strings to any JSON value- Example:
[{"text": "The quick brown fox jumps over the lazy dog"}, {"text": "Lorem ipsum dolor...", "metadata": {"language": "latin", "page_number": 16}}]
- List of any JSON value
- Example:
[1, {"key": "value", "nested": [{}]}, null, ...]
- Example:
- JSON object
- Example:
{"key": "value"} - Example:
{"key": [{"nested": {"hello": "world"}}]}
- Example:
Here's an example of creating a flexible test case:
flexible_test_case = sgp_client.evaluation_datasets.test_cases.create(
  evaluation_dataset_id=flexible_evaluation_dataset.id, # specify all the usual test case fields
  ...,
  test_case_data=dict(
      input={
      "string_input": "string",
      "number_input": 100.101,
      "messages_input": [{"role": "user", "content": "..."}],
      "chunks_input": [{"text": "...", "metadata": {"meta_key": "..."}}],
      "list_input": [1, "hello"],
      "json_object_input": {"hello": "world"}
    },
    "expected_output": {
      "string_expected": "string"
      ... # also supports number, messages etc.
    }
  )
)
After publishing the flexible evaluation dataset we can view it in the UI:
Flexible Outputs
After you create a flexible evaluation dataset, you can create a test case output for each input which represent the outputs from running an application on a test case. Test case outputs generated from flexible evaluation datasets can also accept a dictionary where each key is a string and each value is one of (just like in flexible test cases):
- String
- Number
- Messages
- Chunks
- List of any JSON value
- JSON object
Here's an example of uploading test case outputs:
test_case_outputs = sgp_client.application_test_case_outputs.batch(
    items=[
        dict(
            test_case_id=flexible_test_case.id, # specify all the usual test case output fields
            ...,
            output=dict(
                generation_output={
                    "string_output": "string",
                    "number_output": 100.101,
                    "messages_output": [{"role": "user", "content": "..."}],
                    "chunks_output": [{"text": "...", "metadata": {"meta_key": "..."}}],
                    "list_output": [1, "hello"],
                    "json_object_output": {"hello": "world"}
                }
            )
        )
    ]
)
Attaching Traces to Outputs
While having multiple inputs and outputs enables us to evaluate most typical applications, many complex or agentic AI applications have multiple intermediate steps (e.g. reasoning, retrieval, tool use) that are crucial to evaluate so we can understand what's happening inside our application. Attaching traces to test case outputs allows us to record all of these intermediate steps.
A trace keeps a record of the inputs and outputs of every step as your application executes. It's operation input and operation output must be a dictionary of string keys to values of type string, number, messages, etc., just like the input to flexible test cases.
from datetime import datetime, timedelta
start = datetime.now()
trace = [
  {
    "node_id": "tool_call", # an ID that identifies what this step is
    "operation_input": {"string_input": flexible_test_case.test_case_data["input"]["string_input"]},
    "operation_output": {
      "initial_plan": "I need to analyze how the corporate debt cycle in the U.S. interacts with the overall business cycle by reviewing fundamental economic theory and models.\n\neconomic_textbook_search_tool(query='How does the corporate debt cycle relate to the business cycle?')",
    },
    "start_timestamp": start.isoformat(),
    "duration_ms": 1000
  },
  {
    "node_id": "completion",
    "operation_type": "COMPLETION", # tag that this is a completion operation. Note that this is optional; if not specified, then will default to "CUSTOM"
    "operation_input": {
        "initial_plan": "I need to consult foundational economic theory to understand the relationship between corporate debt cycles and business cycles.\n\neconomic_textbook_search_tool(query='How does the corporate debt cycle relate to the business cycle?')",
    },
    "operation_output": {
        "string_output": "string",
        "number_output": 100.101,
        "messages_output": [{"role": "user", "content": "..."}],
        "chunks_output": [{"text": "...", "metadata": {"metadata": "..."}}],
        "list_output": [1, "hello"],
        "json_object_output": {"hello": "world"}
    },
    "start_timestamp": (start + timedelta(milliseconds=1000)).isoformat(),
    "duration_ms": 1000
  },
]
This is how you can attach the trace to a test case output:
test_case_outputs = sgp_client.application_test_case_outputs.batch(
    items=[
        dict(
            test_case_id=flexible_test_case.id, # specify all the usual test case output fields
            ...,
            output=dict(
              generation_output={
                "string_output": "string",
                "number_output": 100.101,
                "messages_output": [{"role": "user", "content": "..."}],
                "chunks_output": [{"text": "...", "metadata": {...}}],
                "list_output": [1, "hello"],
                "json_object_output": {"hello": "world"}
              }
            ),
            trace_spans=trace,
        )
    ]
)
Typically you would want to generate traces automatically in your external application. Here's what that would look like building on the External Applications guide:
from typing import Any
from datetime import datetime

def my_app(input: Dict[str, Any]):
    trace = []

    start = datetime.now()
    input_string = input["string_input"]
    output_tool_call = ... # do something here
    trace.append({
        "node_id": "tool_call",
        "operation_input": {
            "string_input": input_string,
        },
        "operation_output": {
            "initial_plan": output_tool_call,
        },
        "operation_expected": { # optionally provide an operation expected
    	    "economic_textbook_search_tool(query='How does the corporate debt cycle relate to the business cycle?')"
        }
        "start_timestamp": start.isoformat(),
        "time_elapsed": (datetime.now() - start).total_seconds() * 1000
    })

    start = datetime.now()
    output_completion = ... # do something here
    trace.append({
        "node_id": "completion",
        "operation_type": "COMPLETION",
        "operation_input": {
            "initial_plan": output_tool_call
        },
        "operation_output": output_completion,
        "start_timestamp": start.isoformat(),
        "time_elapsed": (datetime.now() - start).total_seconds() * 1000
    })

    return ExternalApplicationOutputCompletion(
        generation_output=output_completion,
        trace_spans=trace,
    )
Attaching Custom Metrics to Outputs
Note that custom metrics can be used for any external app — you don't need a flexible evaluation dataset or traces
You can also attach custom metrics to outputs. Metrics are numerical values that can be used to record, e.g., how many tokens it took to generate an output or calculated evaluation metrics like F1 or BLEU scores.
Metrics can be passed as a dictionary mapping a string key to a numeric value:
test_case_outputs = sgp_client.application_test_case_outputs.batch(
  items=[
    dict(
      test_case_id=flexible_test_case.id, # specify all the usual test case output fields
      ...,
      metrics={
        "tokens_used"=1234,
        "ROUGE"=0.8,
      }
    ),
    dict(
      test_case_id=other_test_case.id,
      ...,
      metrics={
        "tokens_used"=1950,
        "ROUGE"=0.94,
      }
    )
  ]
)
You can create an evaluation to see metrics on the Metrics tab or the Table tab:
Note that you can configure how metrics are aggregated on Metrics and filter by metric values on the Table.
Create a custom Annotations UI
By default, the annotation UI which annotators see in SGP shows the test case input, expected output, and output. However, for complex evaluations may want to:
- display data from the trace
- select which parts of test case inputs and test case outputs to display
- modify the layout the annotation UI
The Annotation Configuration allows you to do all three.
Here's what an example annotation configuration looks like:
from scale_gp.lib.types.data_locator import data_locator # this is a helper to produce

annotation_configuration = dict(
  annotation_config_type="flexible", # this is the default, so we could have omitted annotation_config_type entirely.
  direction="row", # or "col"
  components=[ # 2D array representing how things will be layed out in the UI
    [
      dict(data_loc=["test_case_output", "output", "string_output"], label="string output"),
      dict(data_loc=["test_case_data", "expected_output", "string_expected"]),
    ],
    [
      dict(data_loc=data_locator.test_case_output.output["messages_output"]), # The data_locator is an easier way of producing data_locs
    ],
    [
      dict(data_loc=data_locator.trace["tool_call"]).input["string_input"] # reference the "tool_call" node from the trace earlier
    ]
  ]
)

evaluation = sgp_client.evaluations.create(
  ... # specify all the usual evaluation fields,
  annotation_config=annotation_configuration,
)
When a contributor annotates this evaluation in the UI, they will see an annotation UI that looks something like this:
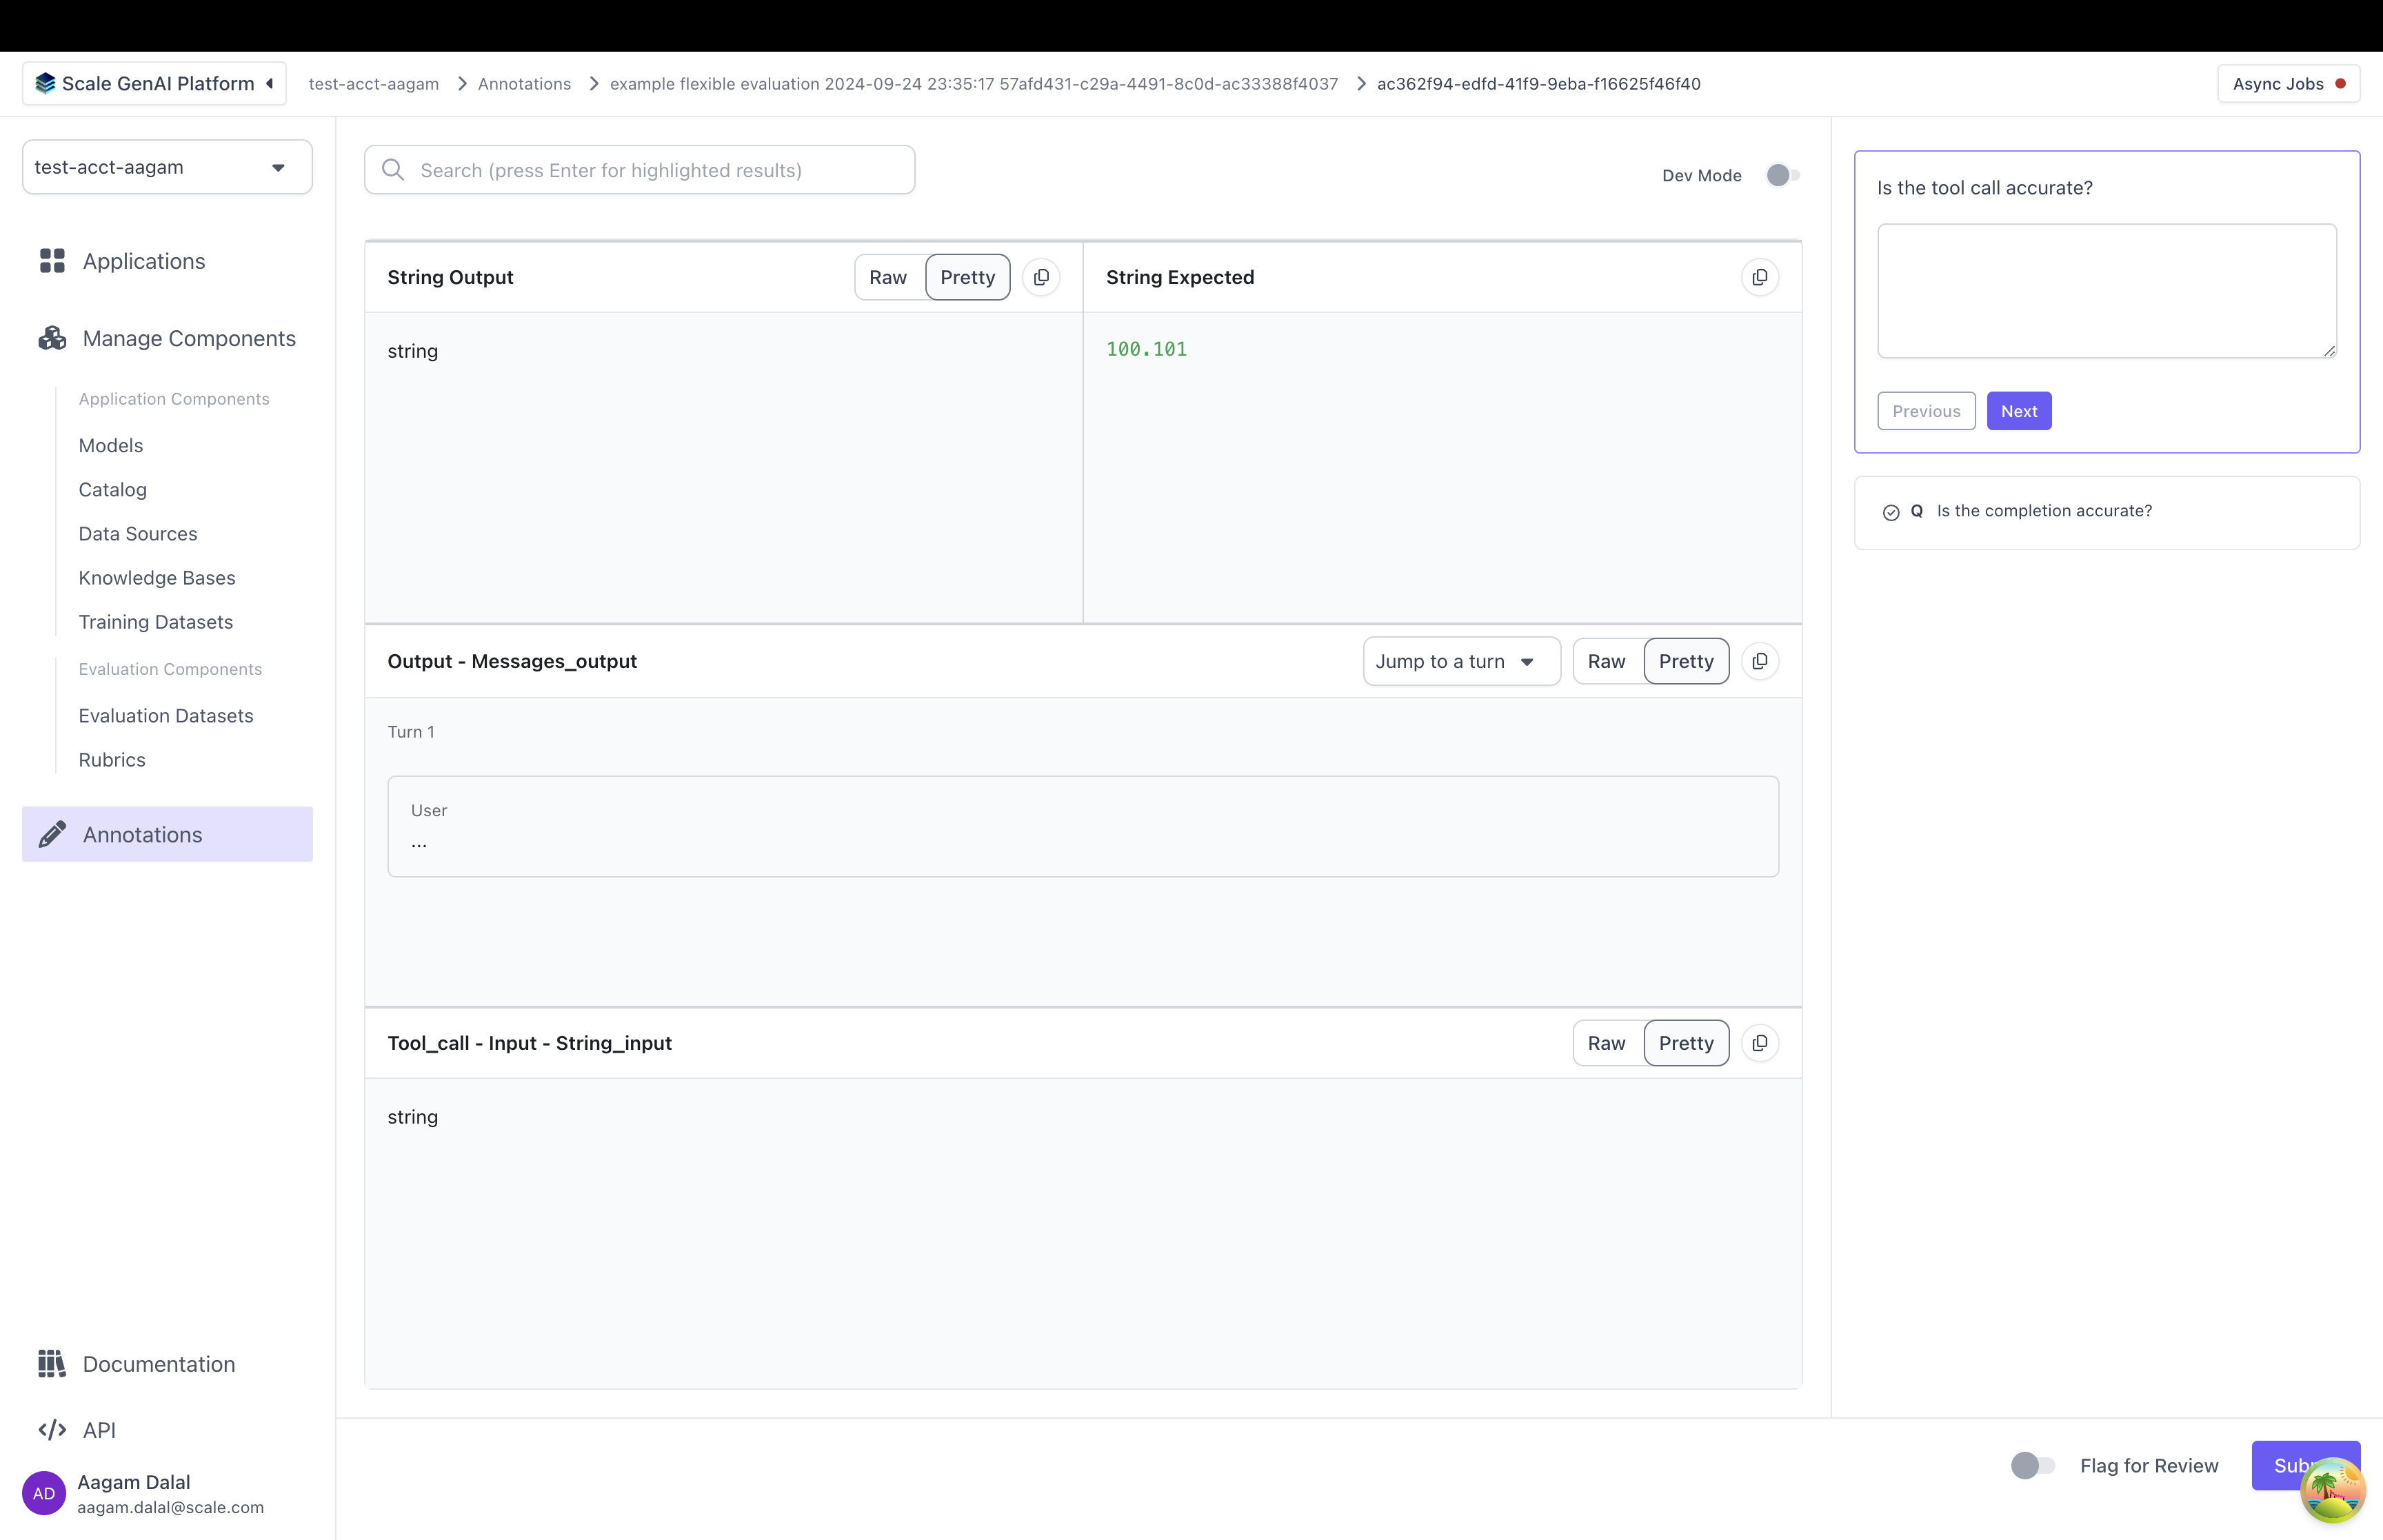
Let's break down how a custom annotation config is set up:
annotation_config_type: by default this is "flexible". The other types are "summarization" and "multiturn" which make it easier to work with specific use casescomponents: this is a 2D list of annotation items. Each annotation item points to somewhere in the test case data, test case output, or trace. When the annotator grades the test case output, they will see data pulled from each location- Each annotation item has a "data_loc" field and an optional "label" field. The "data_loc" is an array that points to where annotation data should be pulled from. The "label" is a name to be displayed to a user for the "data_loc".
⚠️ if a "data_loc" points somewhere that doesn't exist for one or more test cases, you will not be able to create the evaluation.
- Each annotation item has a "data_loc" field and an optional "label" field. The "data_loc" is an array that points to where annotation data should be pulled from. The "label" is a name to be displayed to a user for the "data_loc".
direction: by default "row". Decides whether components are laid out as rows or as columns
Here's are some examples of how different arrangements of components produce different UIs:

data_locs can take any of these shapes:
data_locator Helper | data_loc array | Meaning |
|---|---|---|
data_locator.test_case_data.input | ["test_case_data", "input"] | Display the entire input from the test case |
data_locator.test_case_data.input["<input key>"] | ["test_case_data", "input", "<input key>"] | Displays a single key from the input |
data_locator.test_case_data.expected | ["test_case_data", "expected_output"] | Display the entire expected output from the test case |
data_locator.test_case_data.expected["<expected output key>"] | ["test_case_data", "expected_output", "<expected output key>"] | Display a single key from the expected output |
data_locator.test_case_output | ["test_case_output", "output"] | Display the entire output from the test case output |
data_locator.test_case_output["<output key>"] | ["test_case_output", "output", "<output key>"] | Display a single key from the output |
data_locator.trace["<node id from the trace>"].input | ["trace", "<node id from the trace>", "input"] | Display the entire input from a single part of the trace |
data_locator.trace["<node id from the trace>"].input["<input key>"] | ["trace", "<node id from the trace>", "input", "<input key>"] | Display a single key from the input of a part of the trace |
data_locator.trace["<node id from the trace>"].output | ["trace", "<node id from the trace>", "output"] | Display the entire output from a single part of the trace |
data_locator.trace["<node id from the trace>"].output["<output key>"] | ["trace", "<node id from the trace>", "output", "<output key>"] | Display a single key from the output of a part of the trace |
data_locator.trace["<node id from the trace>"].expected | ["trace", "<node id from the trace>", "expected"] | Display the entire expected output from a single part of the trace |
["trace", "<node id from the trace>", "expected", "<expected key>"] | `data_locator.trace[""].expected[""] | Display a single key from the expected output of a part of the trace |
It is highly recommended that you use the data_locator helper instead of manually creating the data_loc array.
Customizing the Annotation UI per question
Sometimes, you have certain questions in an evaluation rubric that are relevant only to a specific part of the test case, test case output or trace. For instance, you might ask a question specifically about the "completion" or "reranking" step in the trace.
In that case you can create a question_id_to_annotation_config mapping that lets you override the annotation config for a specific question ID:
question_id_to_annotation_config = {
    questions[1].id: dict(
        components=[
            [
                dict(
                    data_loc=data_locator.trace["completions"].input,
                    label="string output",
                ),
                dict(
                    data_loc=data_locator.trace["completions"].output
                )
            ],
            [
                dict(
                    data_loc=data_locator.trace["completions"].expected
                ),
            ],
        ],
    )
}

evaluation = sgp_client.evaluations.create(
  ... # specify all the usual evaluation fields,
  annotation_config=annotation_configuration,
  question_id_to_annotation_configuration=queston_id_to_annotation_config # where specified, overrides the annotation_config
)
In the annotation UI, the information rendered will now change for each respective evaluation question as mapped above:
Dev Mode
SGP also supports "Dev Mode" which allows an annotator to view all the inputs, outputs and the full trace all at once. You can toggle Dev Mode by clicking on the top right in the annotation UI:
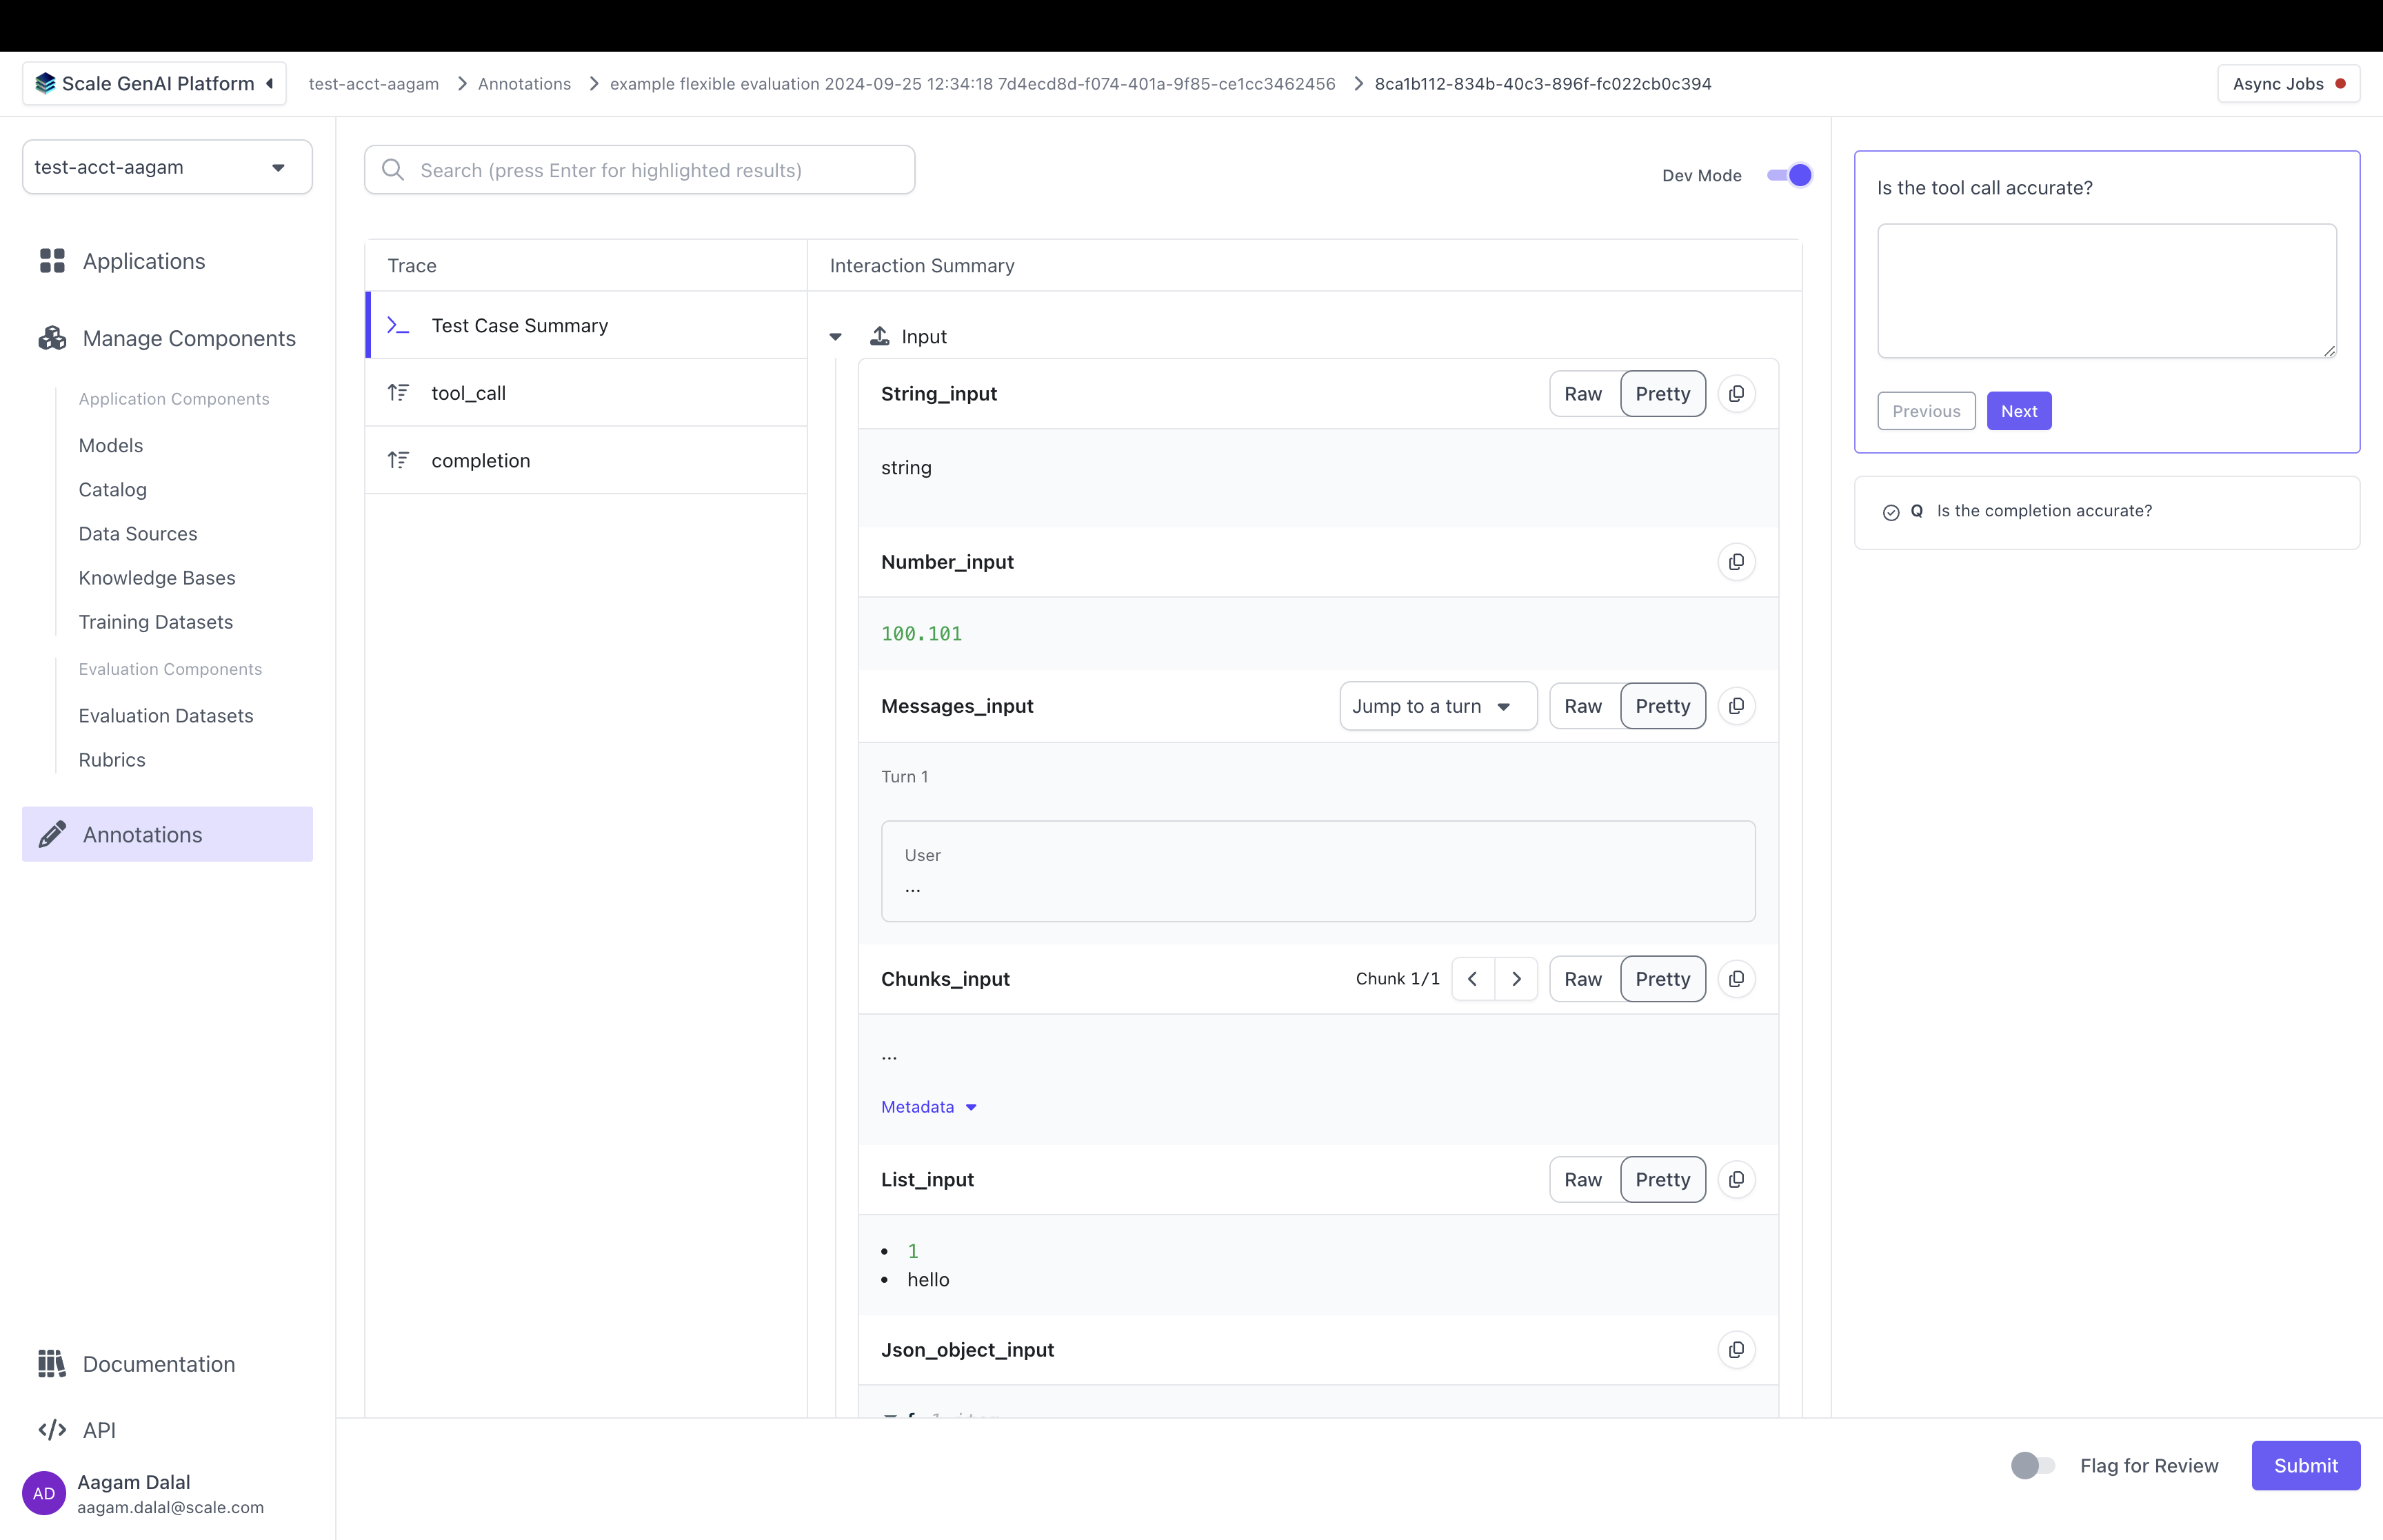
Dev Mode turned on. An annotator can toggle dev mode using the "Dev Mode" switch in the top right corner.
Flexible Evaluation Limitations
Flexible evaluations are currently only available for human evaluations. Auto-evaluations cannot be used flexible datasets or annotation configurations. Flexible evaluations are currently only supported for external applications and can only be triggered via the SDK. We will add the support for native SGP applications on flexible evaluations soon.
What's Next
To get started building with flexible evaluations, take a look at the Flexible Evaluation recipe
Updated over 1 year ago